


Power BI is a collection of software services, apps, and connectors that work together to turn your unrelated sources of data into coherent, visually immersive, and interactive insights. Your data might be an Excel spreadsheet, or a collection of cloud-based and on-premises hybrid data warehouses. Power BI lets you easily connect to your data sources, visualize and discover what's important, and share that with anyone or everyone you want.
The parts of Power BI
Power BI consists of several elements that all work together, starting with these three basics:
A Windows desktop application called Power BI Desktop.
An online software as a service (SaaS) service called the Power BI service.
Power BI Mobile apps for Windows, iOS, and Android devices.
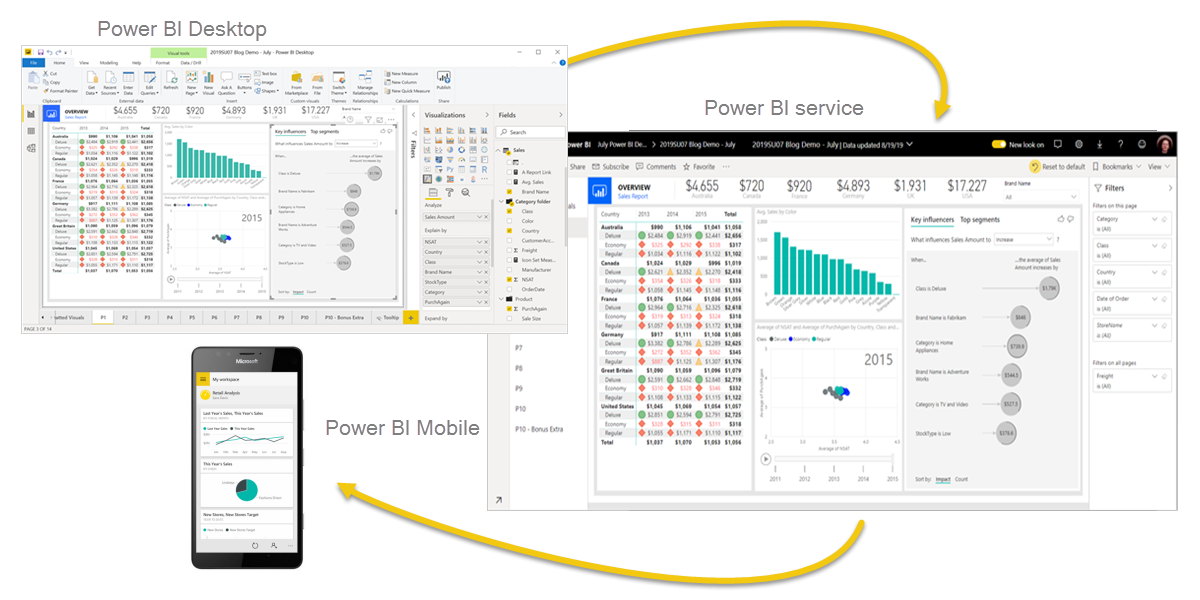
These three elements—Power BI Desktop, the service, and the mobile apps—are designed to let you create, share, and consume business insights in the way that serves you and your role most effectively.
Beyond those three, Power BI also features two other elements:
- Power BI Report Builder, for creating paginated reports to share in the Power BI service. Read more about paginated reports later in this article.
Power BI Report Server, an on-premises report server where you can publish your Power BI reports, after creating them in Power BI Desktop. Read more about Power BI Report Server later in this article.
What is Power BI used for?
Whether you’re a data pro or are just entering the business world, Power BI is designed to empower you with data-driven insights. Some of the most common uses for the platform include:
- Creating reports and dashboards that present data sets in multiple ways using visuals
- Connecting various data sources, such as Excel sheets, onsite data warehouses, and cloud-based data storage, and then transforming them into business insights
- Turning data into a wide range of different visuals, including pie charts, decomposition trees, gauge charts, KPIs, combo charts, bar and column charts, and ribbon charts – among many other options
- Providing company-wide access to data, data visualization tools, and insights in order to create a data-driven work culture
Who uses Power BI?
Power BI users aren’t limited to data professionals, such as data scientists or data engineers, and can include a wide range of different business users. In fact, the platform is intentionally designed so non-technical users can easily create reports, manipulate data, and perform in-depth data analysis operations.
Nonetheless, some of the most common analyst positions that use the platform on a daily basis include the following:
Business analysts
Business intelligence analysts
Supply chain analysts
Data analyst
What is Power BI Desktop?
Power BI Desktop is a free application you install on your local computer that lets you connect to, transform, and visualize your data. With Power BI Desktop, you can connect to multiple different sources of data, and combine them (often called modeling) into a data model. This data model lets you build visuals, and collections of visuals you can share as reports, with other people inside your organization. Most users who work on business intelligence projects use Power BI Desktop to create reports, and then use the Power BI service to share their reports with others.
The most common uses for Power BI Desktop are as follows:
Connect to data.
Transform and clean data to create a data model.
Create visuals, such as charts or graphs that provide visual representations of the data.
Create reports that are collections of visuals on one or more report pages.
Share reports with others by using the Power BI service.
People who are responsible for such tasks are often considered data analysts (sometimes referred to as analysts) or business intelligence professionals (often referred to as report creators). Many people who don't consider themselves an analyst or a report creator use Power BI Desktop to create compelling reports, or to pull data from various sources. They can build data models, and then share the reports with their coworkers and organizations.